Words and numbers: a comparative study of medical and journalism students’ descriptors of risk, numeracy and preferences for health risk communication | BMC Medical Education

Of the 395 students invited to participate, 203 (51%) responded resulting in a response rate of 65% (71/109) for journalism students and 46% (132/286) for medical students. The characteristics of participants by course (medicine, journalism) are given in Table 1. A sensitivity analysis identified that results were broadly similar for all journalism students combined into one group or split into the two journalism programmes. Results are presented for the combined journalism group.
The majority of participants were female (n = 129, 64%), aged 25 years or younger (n = 141, 70%), born in Ireland (n = 128, 63%) and spoke English as a first language (n = 180, 89%). 20% of participants had a postgraduate qualification and 39% had at least one year of relevant work experience relevant to their degree programme. Medical students tended to be older, more likely to have a postgraduate qualification and less likely to be born in Ireland than journalism students, reflecting the graduate entry and international route into the medical programme. When asked ‘how good at mathematics are you on a scale of 1 to 7’, the median rating of perceived mathematics ability was lower for journalism students compared to medical students (median of 4 compared to 5, p < 0.001). Numeracy was measured by adding the total correct out of six questions on the adapted Lipkus numeracy scale, and scores were higher for medical students compared to journalism students (median of 6 correct vs. 5 correct, p < 0.001). The final two questions of the scale asked students to calculate with risks i.e. ‘double’ and ‘half’ numbers in different risk formats. Medical students performed better on these two questions compared to journalism students (89% correctly answered both questions vs. 51% respectively).
Words and numbers describing risk
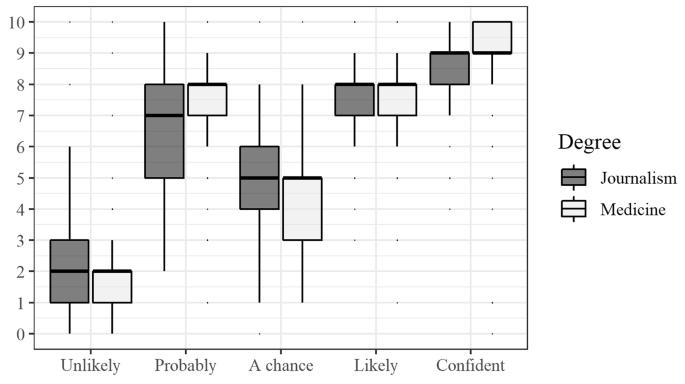
The numbers from 0 to 10 assigned by participants to qualitative descriptors of the risk of an event occurring are summarised in Table 2. Numbers assigned to the descriptor ‘A chance’ had the highest variability for medical students with 25% of medical students assigning it the number 3 or lower and 50% assigning it the number 5 or higher. Numbers assigned to the descriptor ‘Probably’ had the highest variability for journalism students with 25% of journalism students assigning it the number 5 or lower and 25% assigning it the number 8 or higher (Table 2).
The distributions of numbers were similar across courses for the words ‘Unlikely’, ‘A chance’ and ‘Likely’ but different for the words ‘Probably’ and ‘Confident’. The wide variation in numbers assigned to ‘Probably’ is illustrated in Fig. 2 with a lower median value of 7 for journalism students compared to 8 for medical students. While the majority of students in both courses assigned the number 9 or 10 to being ‘Confident’ an event would occur, 25% of journalism students assigned the number 8 or below.

Distribution of numbers assigned to qualitative descriptors of risk by course. (n = 68 for journalism and n = 127 for medicine – missing data for 8 participants)
Risk communication
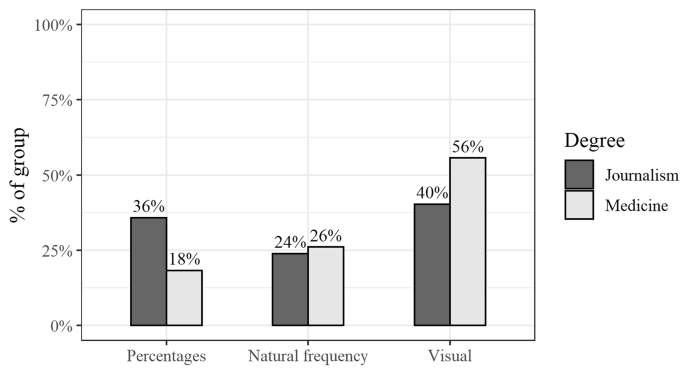
The preferences for format of risk communication (percentages, natural frequency or visual) by course (medicine, journalism) are summarised in Fig. 3. The most popular preference for risk communication was using visual aids for both courses (56% of medical students and 40% of journalism students) but using percentages was twice as popular with journalism students compared to medical students (36% vs. 18%). Students who preferred the natural frequency format of communicating risk had a lower median of 4 on a scale of 1 to 7 for perceived mathematics ability compared to a median of 5 for students who preferred percentages or visual aids. Median scores for performance on the numeracy scale were similar for all three formats (median of 6 for each format, p = 0.63).

Preferred method for communicating risk by course (% of each course). (n = 67 for journalism and n = 115 for medicine – missing data for 21 participants)
After deciding on their preferred format for communicating risk of a heart attack and how taking a drug would change that risk, participants were asked if they were the patient, would they take the drug? The majority of participants who responded to this question said yes (118/143, 83%) with high rates for both journalism students (88%) and medical students (79%). The percentage of those who would take the drug was 95% for those who preferred percentages as the format for communicating risk, compared to 76% for natural frequency and 81% for visual (p = 0.08). For those who decided not to take the drug (n = 25), the most common reason given related to a perceived insufficient reduction in risk to justify taking the drug (n = 11) or concerns/not enough information about side effects of the drug (n = 8).
Reasoning behind risk communication preferences
Participants were asked why they chose their preferred format for communicating risk and 169 students (83% of participants) provided free-text comments. Three themes emerged: ‘Good Communication’, ‘Elicit a response’ and ‘Learning styles’. Themes, subthemes and examples of responses are given in Table 3.
The first theme, ‘Good communication’, focused on the quality and style of the description of risk in terms of how information was delivered. Subthemes that emerged included easy to understand, concise or quick, clear, simple and comprehensive. For example, a medical student chose percentages as the preferred method for communicating risk because “It was the clearest and the percentages were easier to understand” and a journalism student chose natural frequency because it was “concise, less jargon”.
The second theme that emerged was a preference for communication that acknowledged different ‘Learning styles’. Subthemes included preferences based on the learning style of the communicator themselves, learning styles of those who would receive the information, as well as preferences for modalities characterised as more ‘personal’. For example, a medical student chose visual as the preferred method for communicating risk because “I am a visual learner and can understand better with a visual representation” and a journalism student chose visual because it was “not boggy text with dense details”. A medical student who chose visual was considering learning styles of others and what was best to be “used clinically depending if a person is a visual or audio learner” and another “felt it was more personal to see human shapes rather than numbers”.
The third theme focussed on the ability of the method of communication to ‘Elicit a response’. Subthemes included provoking an action or specifically evoking an emotional response. For example, a journalism student chose percentages as the preferred method for communicating risk because “it can help the patient to take action” and a medical student chose natural frequency because “when I hear of 10 people, I think of close friends and family”.
We noted a difference between the themes that emerged for percentages and natural frequency and those that emerged for the choice of a visual method for communicating risk. Analysis of responses in this latter category saw ‘Learning styles’ feature far more prominently, particularly the learning style of those being communicated to. ‘Good communication’ was the dominant theme that emerged for both medical and journalism students who chose percentages or natural frequency as their preferred method for communicating risk. ‘Good communication’ in these instances tended to be characterised as ‘easy to understand’, ‘clear’ and ‘simple’. While the theme ‘Elicit a response’ features much less prominently in the thematic analysis than ‘Good communication’ and ‘Learning styles’ overall, responses from those who chose natural frequency as their preferred method for communicating risk were more likely to include the ‘evokes an emotional response’ subtheme.
link


