
Patient-physician communication of health and risk information in the management of cardiovascular diseases and diabetes: a systematic scoping review | BMC Medicine

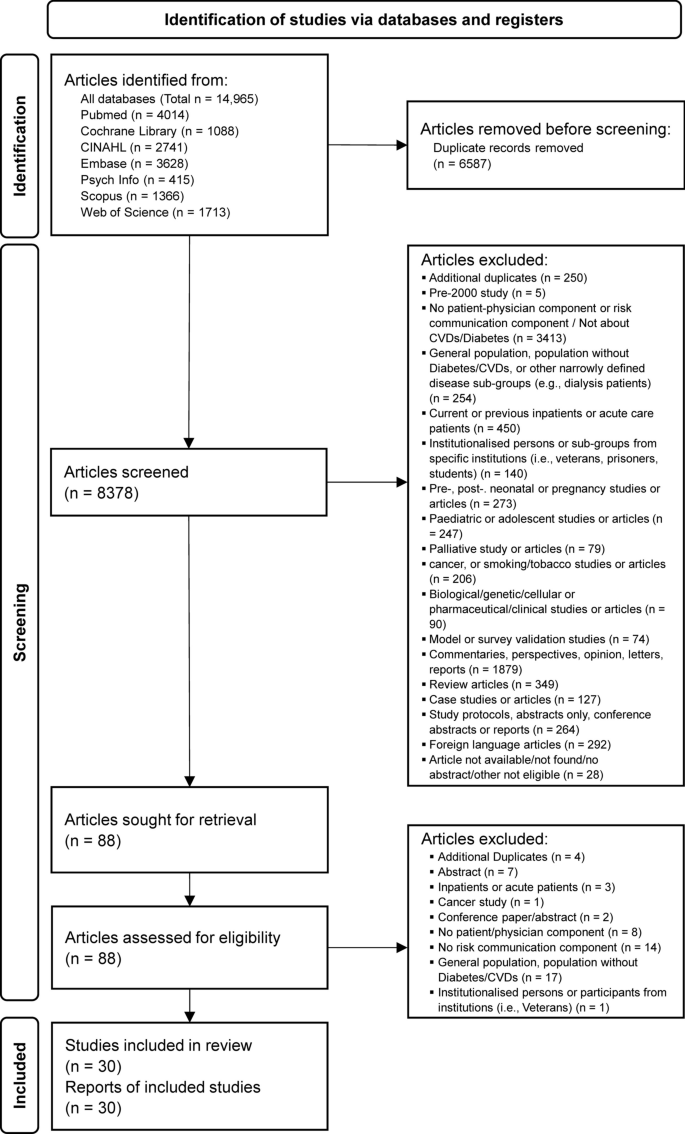
A total of 8378 article titles and abstracts were screened from all databases, of which 8348 were excluded based on the eligibility criteria after consensus was reached by the reviewers (AC, WT). Eighty-eight articles were sought for retrieval for full text to be read and reviewed independently by both reviewers, after which a further 58 articles were excluded. A total of 30 articles were included for data extraction for this review (Fig. 2).
Description of included studies on patient-physician risk communication
Studies identified were heterogenous in scope and focus. Of the 30 of articles included, 22 articles are related to CVDs (n = 22/30, 73.3%), comprising 13 qualitative (n = 13/22, 59.1%), 9 quantitative studies (n = 9/22, 40.9%), and 1 mixed methods study (n = 1/22, 4.5%). Out of 13 qualitative studies, 10 used a semi-structured interview approach to data collection (n = 10/13, 76.9%), with 1 study using a qualitative descriptive approach (n = 1/13, 7.7%), 1 that conducted focus group discussions (n = 1/13, 7.7%), and 1 using both participant observation and interviews (n = 1/13, 7.7%). Out of 9 quantitative studies related to CVDs, 7 were randomised controlled or controlled trials (n = 7/9, 77.8%), 1 an interrupted time-series study (n = 1/9, 11.1%), and 1 a cross-sectional study (n = 1/9, 11.1%). 7 out of 30 articles included in this review are related to diabetes (n = 7/30, 26.7%), comprising a total of 2 qualitative (n = 2/7, 28.6%) and 5 quantitative studies (n = 5/7, 71.4%). Out of the 2 qualitative studies, 1 used a semi-structured interview (n = 1/2, 50.0%), and 1 a focus group discussion approach (n = 1/2, 50.0%). For 5 quantitative studies related to diabetes, 3 studies were randomised controlled trials (n = 3/5, 60.0%) and 2 studies were cross-sectional (n = 2/5, 40.0%).
Studies selected were conducted in or referred to primary or secondary care settings. Of 22 articles on CVD, 17 studies referred to primary care settings (n = 17/22, 77.3%), while 3 occurred in secondary care settings (n = 3/22, 13.6%), and 3 in both primary and secondary care settings (n = 3/22%). Primary care settings were mainly GPs (n = 11/17, 64.7%), family practices (n = 3/17, 17.6%), and community health centres (n = 1/17, %). 2 studies did not state specifically the actual primary care type (n = 2/17, 11.8%). Secondary care settings were mainly atrial fibrillation or transient ischemic attack clinics (n = 3/17, 17.6%). 3 studies that included participants from both primary and secondary care settings did not specifically state the exact venue of research conducted. Only 1 mentioned primary care setting as GP sites. Out of 7 articles on diabetes, 3 studies referred to primary care settings (n = 3/7, 42.9%), and 4 to secondary care settings (n = 4/7, 57.1%). Primary care settings were GPs, community health service centres, and 1 which was not stated. Secondary care settings were a teaching hospital, university clinic, a surgery practice, and a diabetes centre. A summary of key characteristics of included studies can be found in Table 2.
Most studies on patient-physician risk communication were conducted and concentrated in several high-income countries (HICs) in Europe, North America, and Oceania, such as the UK (n = 7/30, 23.3%), Germany (n = 4/30, 13.3%), Netherlands (n = 3/30, 10.0%), Denmark (n = 1/30, 3.3%), Sweden (n = 1/30, 3.3%), France (n = 1/30, 3.3%) in Europe; USA (n = 7/30, 23.3%), Canada (n = 1/30, 3.3%) in North America, and 1 each in Australia and New Zealand, respectively. Only 1 (1/30, 3.3%) [70] study was conducted in an upper middle-income country (UMICs) (China), and only 2 (2/30, 6.6%) [60, 63] conducted in 2 lower middle-income countries (LMICs) (Egypt and Indonesia), suggesting a paucity of research from non-HIC countries. There were no studies from countries in Africa, South America or other parts of Asia other than China. A summary of countries where studies are conducted can be found in Table 3.
Understanding risk in the context of patient-physician communication
CVD-related risk information
Fifteen articles, consisting of 8 qualitative [45, 47, 49, 50, 52, 53, 56, 59], 6 quantitative studies [41, 42, 51, 57, 60, 62] and 1 mixed methods study [54] focused on different aspects of patient-physician risk communication. We summarise and cluster the articles into 3 thematic areas emergent from articles on CVDs: (1) understanding and recalling risk information in the context of patient-physician communication, (2) risk formats and their effects on the risk communication process, and (3) perception of risk information over time.
Understanding and recalling risk information
Many patients tend to perceive risk in binary terms, such as whether they were ‘at risk’ or ‘not’ [52], or understood future risks in generic, non-numeric terms, even if numeric values were often used to discuss weight, blood pressure and medication dosage [56]. A qualitative study of patients with high 10-year CVD risk in the UK found that most patients do not remember receiving explanations about their CVD risk score or what their scores mean [53]. As such, most healthcare professionals tend to explain risk narratively rather than describe risk in percentage terms to patients [53]. In a study conducted in Vancouver, Canada, physicians describe how atrial fibrillation (AF) patients tend to overestimate their bleeding risk regarding anti-coagulants and have difficulty weighing risk against benefits [59]. In response to a lack of interest or inability of patients to understand their own risk, physicians communicate an individual’s risk of stroke to a patient less often unless there is a need to do so, such as when patients show resistance towards medications, if there is an unjustified fear of bleeding, or where there is poor understanding towards how medications can reduce risk [59].
For patients with asymptomatic conditions, a common problem is recognising and acknowledging risks that may not be apparent due to a lack of symptoms. A qualitative study to understand the experience of transient ischaemic attack (TIA) patients during consultation sessions found that prior knowledge and health beliefs influence actions taken by patients and that a lack of symptoms leads to less recognition of risks [47]. Many patients, such as those with high cholesterol who do not have manifest symptoms, find their risks unpredictable, unstable and abstract. These patients also have a poor understanding of CVD risk factors and do not perceive hypercholesterolemia to be a risk factor for CVDs [49]. Physicians of AF patients find it worrying that patients often associate symptom severity with the risk of stroke, who believe correspondingly that having a lack of symptoms implies not being at risk [59].
One intervention study using probabilistic scenarios conducted with GPs, healthcare assistants, and laypeople to test the level of minimum absolute risk required for participants to justify prescribing a hypothetical tablet able to prevent heart attack over 5 years, found that most participants think it makes no difference if a drug is consumed over 10 instead or 5 years, even if the benefit was greater over a longer time period, suggesting challenges in risk estimation even for healthcare professionals [50]. An intervention study that aims to facilitate the communication of CVD risks between patients and physicians by providing patients with a tablet containing a series of educational modules that patients have to watch prior to consultation sessions, found that having a sequence of educational intervention makes it easier for patients to speak to their physicians and have a better understanding of why controlling CVD risk factors is important [57].
Different risk formats and its effect on the risk communication process
Multiple studies focused specifically on risk formats and how they shape the risk communication process. 1 qualitative study that interviewed GPs in New South Wales, Australia, suggests how pragmatic considerations can affect how physicians choose to convey risk [45]. The study finds that physicians prefer using qualitative formats for communicating risk to patients who have lower numeric literacy and who are of lower risk, given how discussion of numbers with patients may take up a substantial amount of time. Absolute, relative, and risk displayed in a frequency format, were preferred formats used by GPs to convey information to patients who are at high risk or who had a poorly managed CVD condition. For patients, there was the perception that providing both absolute and relative risk calculations may be unnecessary and confusing since limited information about ways to reduce risk was already received by patients in the first place. Some patients had strong objections to the word ‘absolute’, which was seen as ambiguous and seemed to convey a risk score that was ‘conclusive’ or ‘definitive’ [54].
There was consensus among patients that risk was generally difficult to understand. In one mixed methods study conducted in the UK to evaluate the use of the JBS2 risk calculator and chart within GP settings, patients do not recall seeing a risk assessment tool used, although they agree that the use of tools can increase confidence in risk assessment and aid patients in understanding risks [54]. Patients prefer a risk calculator that indicates risk in the form of a thermometer rather than paper charts, highlighting how a visual thermometer is more appealing, easier to understand and can even be motivational, although anxiety may be evoked for those whose risk is very high [54]. A qualitative study conducted in the UK to understand the experiences of participants presented with a personalised risk report that includes heart age and QRISK2 risk score that predicts a person’s risk of having a stroke or heart attack within the next 10 years, finds that patients tend to recall heart age easier rather than a probabilistic score [52].
Regarding format preferences, a cross-sectional study examining the preferences of patients attending GP practices in Auckland, New Zealand found that relative risk (n = 603/934, 64.5%) was the highest ranked mode of risk presentation preferred, followed by absolute risk (n = 131/934, 14.0%), then natural frequencies (n = 91/934, 9.7%), when it comes to the format that would help a patient to decide. In this study, the relative risk was ranked first by participants who were more numerate (OR = 1.2; 95% CI, 1.0–1.4), by those who were more concerned about a heart attack (OR = 1.1; 95% CI, 1.01–1.2), and less by Pacific Islanders (OR = 0.4) or Asian (OR = 0.4) participants (ethnicity overall, 95% CI, 0.7–0.8). Pictures were preferred over numbers by those who had less schooling (OR = 1.2; CI, 1.1–1.3) and by those who were less numerate (OR = 1.1; CI, 1.01–1.2) [51].
In a multi-component RCT conducted in Egypt to investigate the accuracy of CVD risk perception among patients with diabetes, patients were provided a combination of absolute and relative risk scores conveyed in percentage and frequency formats, and given advice framed positively by physicians on how to change their risk based on WHO/ISH guidelines. Agreement between perceived and objective CVD scores increased substantially for the intervention group (n = 107) (pre-/post- intervention, kappa = 0.271 ± 5.2%, p = 0.0 to 0.837 ± 4.4%, p = 0.0), compared to the control group (kappa = 0.088/ ± 4.5%, p = 0.052 to 0.105 ± 4.6%, p = 0.022), which increased only marginally and remained low [60].
Perception of risk information over time
Two intervention studies suggest that a patient’s perception of risk, although mediated by formatting and visualisation elements that aim to improve understanding, tends to taper off after a period of time. A non-inferiority RCT conducted in Germany to test a time-to-event (TTE) format versus emoticons in representing a patient’s 10-year absolute risk of CVD finds TTE to have a stronger effect on risk perception than emoticons [41], although the effect on perception waned somewhat after 3 months [42]. Another RCT intervention conducted with type 2 diabetes patients newly referred to a diabetes care system in the Netherlands, that used a 6-step CVD risk communication method, found that patients in the intervention group were able to estimate their risk of developing CVD more accurately than those in the control group in the short term (appropriateness of risk perception, intervention 0.33 vs. control − 0.1, difference = 0.48, CI 0.02 to 0.95 (p = 0.04)), but the effect of risk perception diminished after 12 weeks. The intervention used a combination of tools that included conveying to patients their absolute risk scores calculated using the UK prospective diabetes study (UKPDS) risk engine, together with a risk card with a population diagram, and having positively framed risk messages conveyed to patients [62].
Diabetes-related risk information
There were only a small number of studies on patient-physician risk communication focused on diabetes. Five articles, consisting of 2 qualitative [66, 70] and 3 quantitative studies [65, 68, 69], focused on how sufficient information about diabetes-related complications and risks were not conveyed adequately by physicians.
Understanding and recalling risk information
One descriptive cross-sectional study conducted at a diabetes centre describe how only about 23% (32/138) and 14% (19/138) of patients diagnosed with diabetes respectively recall their providers providing them with factual information and warning them about the implications of complications [68]. The low proportion seem to imply a relatively limited number of patients who are conveyed actual risk of complications by their physicians. A focus group discussion conducted with type 2 diabetes patients from community health service centres in Guangzhou, China, describes how patients understand normal blood glucose and HbA1c levels as reflective of a stable condition, and that higher numbers or fluctuating numbers are a source of worry. Though they were concerned about diabetes complications, patient participants were not aware that diabetes was a risk factor for CVDs. Patients found consultations with physicians to be too brief and wanted more information about how diabetes can progress and develop further into complications [70]. Physicians who treat patients with diabetes, describe engaging more with communicatively active patients (CAP) who are able to recognise and respond to new or evolving medication risk information [66].
One pilot RCT study with diabetes patients assessing the feasibility of adopting a new risk communication intervention tool, based on behavioural and psychological concepts in primary care and focusing on diabetes as a risk factor for CVD, found that recall for effective heart age is significantly better than other formats such as 10-year CVD risk, both immediately and 12 weeks after intervention [69]. Another pilot intervention conducted at 2 clinics in the University of Chicago, USA, found that using a web-based decision support tool can improve risk understanding. The intervention consists of an education support module, a model for calculating life expectancy and risk of developing CVDs, a treatment preference questionnaire, and a geriatric screening component consolidated in the form of a personalised report to be delivered to patients prior to a patient’s visit with a physician. The study showed that decisional conflict (DC) is reduced in the intervention group more than in the control group (overall DC score pre-/post-intervention 52.7 ± 33.0 to 24.5 ± 26.7, pre-/post-control 51.2 ± 35.5 to 36.6 ± 33.8, p = 0.07). Although the results for the overall DC scale were not significant, the informed DC subscale which asks about knowledge and risk understanding related to A1c goals was significant (Informed DC subscale score pre-/post-intervention 54.0 ± 40.1 to 18.3 ± 33.7, pre-/post-control 56.0 ± 38.4 to 31.0 ± 41.0, p ≤ 0.001) [65].
Strategies and approaches used by physicians in patient-physician risk communication
Eight articles (5 CVD, 3 diabetes), consisting of 7 qualitative [43, 45, 46, 53, 58, 66, 70] and 1 quantitative study [68], describe strategies and approaches used by physicians to communicate risk information to patients. Strategies used to convey CVD risk include the use of fear or scare tactics [45, 46, 53], the use of strong language to evoke fear [58], the use of positive language [45], downplaying risk [53], or the use of metaphors and analogies to simplify risk information and improve patient’s understanding, such as associating heart function with an electrical system [46]. Other approaches used include presenting different CVD scenarios to those who are less adherent to medication [43], speaking indirectly to patients [45], intervening strategically during ‘teaching’ moments [58], emphasising gradual and continuous change [58], and prioritising discussion points [58].
For patients with diabetes, strategies used by physicians include setting goals [70], using specific words such as ‘common’ or ‘rare’ to describe risks [66], avoiding statistics [66], varying presentation styles to different types of patients [66], and withholding information with low-level risks that may affect a patient’s medication intake [66]. Additional approaches include using dramatic images such as illustrations of amputations to persuade patients [70]. Physicians who provided prompt feedback to patients using clear language and positive body language were viewed positively by patients [70]. Diabetes patients, like patients treated for CVD conditions, similarly mentioned how physicians used fear as a motivator to warn about complications [68].
The use of fear and scare tactics was a recurring theme used by physicians to direct patients towards desired behaviour. If physicians perceived patients to be of higher risk but generally unmotivated about their own health [45], the consequences of risky behaviour and complications that can occur in the future (e.g., such as being bed bound) were used to persuade patients to change [46, 58, 68]. If patients were not ready and receptive to risk information, then physicians would avoid conveying risks directly to avoid alarming or affecting patients negatively [45]. On the contrary, for patients who were motivated or self-activated, physicians use a positive strategy to reassure and encourage patients to focus on achievable change [45], since a communicatively active patient is cognitively ready to receive more information about risks [66].
A complete summary of strategies and approaches used by physicians for CVDs and diabetes-related conditions is described in Table 4.
Communication tools that facilitate patient-physician risk communication
Eight articles (7 CVD, 1 diabetes), consisting of 6 qualitative [43,44,45,46, 52, 61], 1 quantitative [67] and 1 mixed methods study [54], identify tools used to facilitate the communication of CVD risks between patients and physicians. Studies describe the use of personalised risk reports to aid the understanding of risks [52], that contain pictorial information such as colour codes to indicate CVD risk status with visual depictions of arterial plaques [44]. Other tools used include risk charts [45, 54], risk tables [61], drawn diagrams [46], CVD guidelines [43], risk assessment tools [43], results from risk calculators such as the JBS2 calculator in the UK [45, 54], and images such as cholesterol spikes or how the brain looks like during a stroke [45]. For communication tools used by diabetes patients, 1 study found that although most risk factor discussion with physicians still occurs in-person, those who use both phone and messages to communicate risk factors tend to also have higher in-person provider visits, insulin use and poorly controlled Hba1c [67].
Interventions to improve the communication of risk information
Interventions related to CVD conditions
Eight interventions were related to CVDs, of which 6 were RCTs [41, 42, 55, 57, 60, 62], 1 a controlled trial without randomisation [48], and 1 an interrupted time series design [63]. Most interventions used a combination of training and interventional materials for physicians or healthcare providers, along with reinforcing tools provided to patients that emphasise risk management. Interventions usually involve the use of relative and absolute CVD risk scores generated by risk calculators or algorithms [55, 60, 62, 63], or reports that present CVD risk stratification using colour codes [48]. A pocket guideline from the National Health Cholesterol Education Program and WHO/ISH guidelines were used by Casebeer et al. (2009) [48] and Tawfik et al. (2016) [60] respectively. Additional intervention tools include the use of scripts like decision aid [55], use of smiley faces [55], emoticons or time-to-event graphics to visualise risk [41, 42], population diagrams [62], positive framing [62], risk cards [62], educational worksheets [63], checklists [63], patient contract or pledges [48], and chart stickers [48]. 1 study used a tablet with multiple educational modules, linked to a patient’s electronic health records (EHR), that requires a patient to access and watch before attending a consultation session with a physician, spread over a period of 5 visits [57].
Five interventions [48, 55, 57, 62, 63] required patients to actively respond to the risk information and educational materials provided to them by a physician or health professional. This includes pledging to commit to the medical regimen (statin therapy) of the intervention [48], participating in a shared decision-making process with the physician in modifying one’s risk [55], talking to the physician shortly after watching educational modules on a tablet [57], thinking aloud to check if one can explain one’s own risk [62], or completing a checklist to count the number of tick marks one has while assessing the risk category one falls into [63]. 1 intervention study, the Heart Health Counts program, sent 5 print mailings over a 4-month period to patients who are new to statin therapy with information focusing on various aspects of CVD risk [48].
Before the start of each intervention, training or meeting sessions are sometimes initiated between physicians and other healthcare professionals to familiarise on study protocol and aims [63], discuss the epidemiology of CVD risk calculations [55], elaborate on the meaning of absolute and relative risks [60] and discuss practical strategies of how to communicate risk information to patients [55, 60, 62, 63]. Sessions are also held to train physicians and healthcare professionals on how to use risk prediction tools such as the adapted Framingham algorithm [55], WHO/ISH CV risk prediction chart [60], or the UKPDS risk engine [62]; to discuss the causes and consequences of CVD risk [62] and discuss the ethics of shared decision making [55]. For 1 intervention, training included explaining behavioural theories such as the Theory of Planned Behaviour and Self-Regulation Theory to physicians [60], although engagement with theoretical concepts was not common among most interventions included in this review. Role-playing was included in some of the intervention training sessions to reinforce learning [55, 63]. Other than a general outline of training procedures, the interventions described do not provide more details regarding the process and flow of training sessions.
Interventions related to diabetes
3 interventions were related to diabetes, consisting of 3 RCTs [64, 65, 69]. All the interventions used a personalised decision aid or support tool to present risks to patients in the form of a report [64, 65, 69]. 1 pilot intervention was specifically guided by ideas from behavioural economics and psychology to shape the design of the intervention, factoring in concepts such as optimistic bias, affect or representative heuristic, risk aversion, present biases and limited attention span to determine the structure of risk format and description of risk information [69]. The intervention study, however, did not go into detail about how concepts are translated into risk information. Personalised reports usually include a patient’s screening test results [64, 65], treatment options or recommended actions that should be taken for specific risk factors [64, 69]. Reports also usually include a calculator that estimates life expectancy or risk of developing complications such as developing a heart attack or risk of amputation or blindness [65], or that estimates heart age [69], with an education module [65]. Risks are described using natural frequencies to convey outcome probabilities relevant to each patient [64, 65, 69]. 1 intervention mentioned setting achievable goals for patients to aim towards to [64], while 2 interventions required patients to discuss their treatment options with a physician after a personalised report was received by the patient [64, 65].
A summary of intervention components and associated studies is described in Table 5.
Health literacy and communication effectiveness assessment in interventions
Interventions related to CVD conditions
Of eight interventions related to CVDs, only 3 studies measured health literacy [55, 57, 63], while 5 studies did not use any health literacy or related measurement tools during the course of interventions [41, 42, 48, 60, 62]. Krones et al. (2008) [55] asked 3 questions on CVD prevention that was measured post-intervention with patients but did not specify what each specific question was. Similarly, Roach et al. (2010) [57] measured “patient knowledge and perception regarding the presence of CVD risk and risk factors” during patients’ first consultation visit, but did not specify what scales or questions were used. Williams et al. (2016) [63] asked 6 questions related to stroke knowledge and associated risk factors, which together formed a ‘knowledge’ index, that was administered to patients after intervention.
To determine whether interventions made a difference in patient-physician communication, or communication with a healthcare professional, 4 out of 8 intervention studies related to CVDs report using measurements to assess whether communication improved [57, 60, 62, 63]. Three studies did not use any measurements at all [41, 42, 48], while 1 study used a scale (the patient participant scale) that the study team was unable to locate at the source article and thus determine if communication effectiveness was measured [55].
Roach et al. (2010) [57] used descriptive questions to check if interventions increased discussion about chronic diseases during consultations. Questions include whether heart attack risk, lowering cholesterol and smoking cessation were specifically discussed during each intervention visit. Tawfik et al. (2016) [60] measured cardiovascular risk perception and accuracy at baseline and at 3 months after intervention. Participants were asked to self-rate their own risk of developing heart disease within 10 years, which was subsequently compared to their actual risk. Welschen et al. (2012) [62] also asked participants to self-rate their risk of developing CVD in 10 years, at 2 to 12 weeks after intervention. Additionally, the Combined outcome measure for risk communication and treatment decision-making effectiveness (COMRADE) ‘satisfaction with communication’ sub-scale was used but mainly regarding interaction with diabetes nurses. Williams et al. (2016) [63] used a ‘discussion’ and ‘recommendation’ index to measure if stroke-related risk factors were discussed with physicians, and whether any recommendations were made.
Interventions related to diabetes
Of three studies related to Diabetes, none reported assessing for health literacy [64, 65, 69]. 2 studies used some form of measurement to check for the effectiveness of communication [65, 69], while 1 study did not assess communication effectiveness at all [64]. In the pilot RCT conducted by Huang et al. (2016) [65], although not specifically about risks, communication about A1C goals was included pre- and post-intervention, as part of the overall decisional conflict scale. Rouyard et al. (2018) [69] mentioned using an adapted COMRADE scale to assess ‘participant’s satisfaction’ as a primary outcome but did not mention which parts of the scale were adapted.
Barriers and facilitators to interventions
Interventions related to CVD conditions
Of eight interventions related to CVDs, 1 study highlighted barriers to interventions [63], 4 studies mentioned facilitators [48, 55, 60, 62], while 3 studies did not mention barriers or facilitators [41, 42, 57]. Barriers mentioned include physicians being overly burdened by the requirements of the intervention, thus not being able to apply the interventions consistently. In discussing stroke risk with patients using a checklist, physicians started limiting conversations to about 10 patients a day, then subsequently communicated less with patients as the study progressed due to a lack of staff and time for each individual patient, as well as poor motivation and lack of buy-in from physicians and nurses [63]. Other barriers include overcrowded and inadequate facilities [63].
Facilitators to interventions include using a multifaceted implementation strategy involving education seminars, printed materials and consultation aids, and incorporating local leaders as part of a multi-step intervention to deliver subjective and objective risk to patients [55]. Other facilitators mentioned include not having the implementation being labour intensive [48], repeating CVD risk communication with patients [60], targeting interventions to those who are newly diagnosed with diabetes [62], and focusing on patients who are already committed to preserving their own health [48]. Welschen et al. (2012) [62] mentioned how engagement with behavioural theories improved the overall effectiveness of intervention by aligning research questions and study methods with outcome measures.
Interventions related to diabetes
Of three intervention studies related to diabetes, 2 studies highlighted barriers related to the implementation of the intervention [64, 69], and 1 study did not mention any barriers or facilitators [65]. Barriers include healthcare providers not being accustomed to the decision aid used as an intervention, using the decision aid only once, perceiving the intervention as unneeded, and not using the intervention as intended for a substantial number of patient participants [64]. Other study-related barriers include implementing the intervention at a single site and having only a short time to follow-up with participants to determine if the intervention has any substantive effects on health outcomes [69].
link


